Advanced configuration
Advanced users: configure Steady yourself
Steady can be customized far beyond its default fields. Four layers work together:
- Sections structure the daily check-in.
- Fields define what you record and how values are interpreted.
- Analytics determines which metrics appear in Explorer and correlations.
- Life Wheel and Recovery connect recorded data with higher-level axes, change areas, counters and resets.
Open configuration mode
Open Today and activate edit mode with the pencil icon. You can manage sections, create fields, and move, edit or hide existing fields.
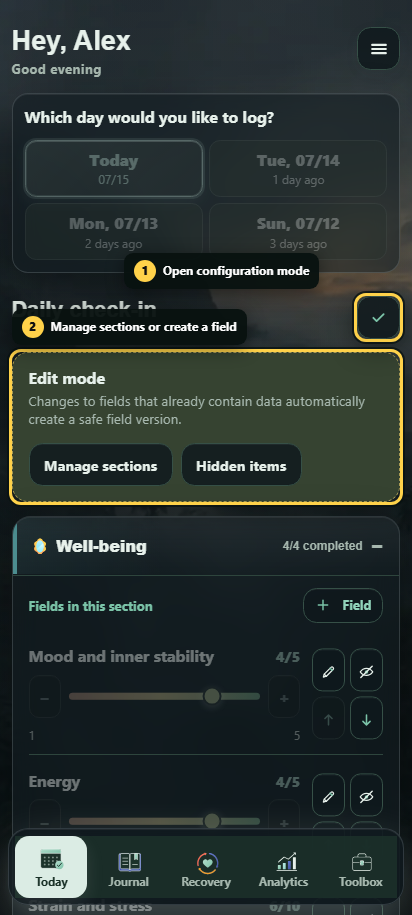
Hiding a field removes it from the current input screen. Existing historical values remain available. Changes that alter a field's meaning can create a new field version so older entries continue to be interpreted correctly.
Sections and Life Wheel axes
Manage sections
Section management controls the order, visibility and activation of groups in the daily check-in.
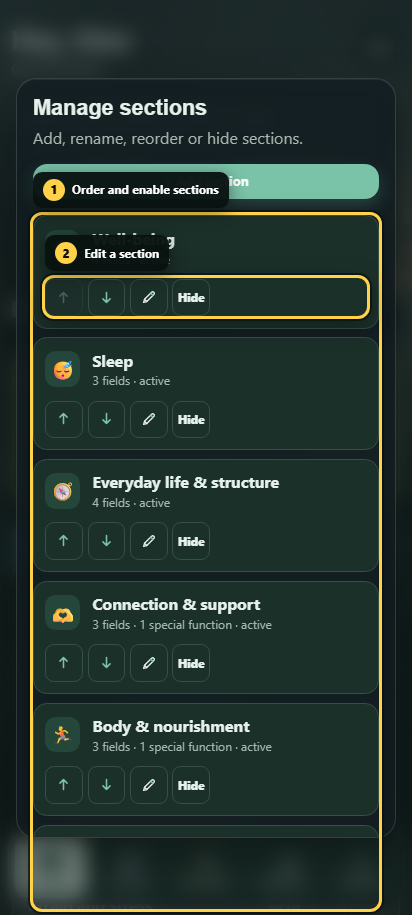
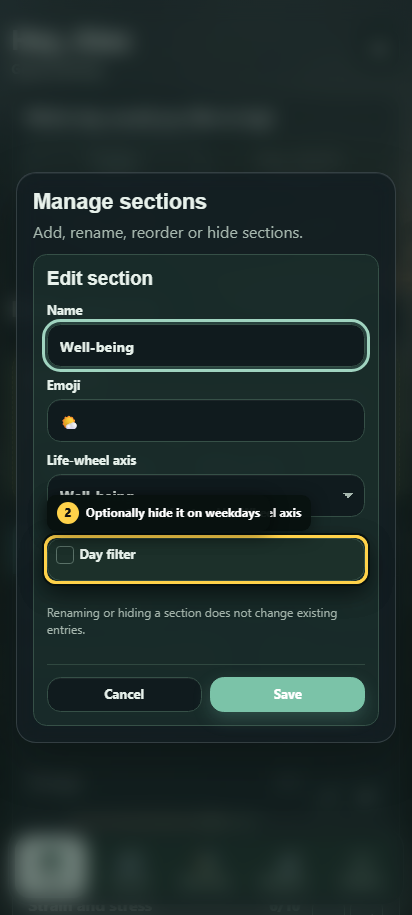
A section can also be hidden on selected weekdays and assigned to exactly one Life Wheel axis.
Manage Life Wheel axes
In Analytics → Patterns, the pencil icon on the Life Wheel opens axis management. You can create, rename and order between three and ten axes. The list shows which sections use each axis.
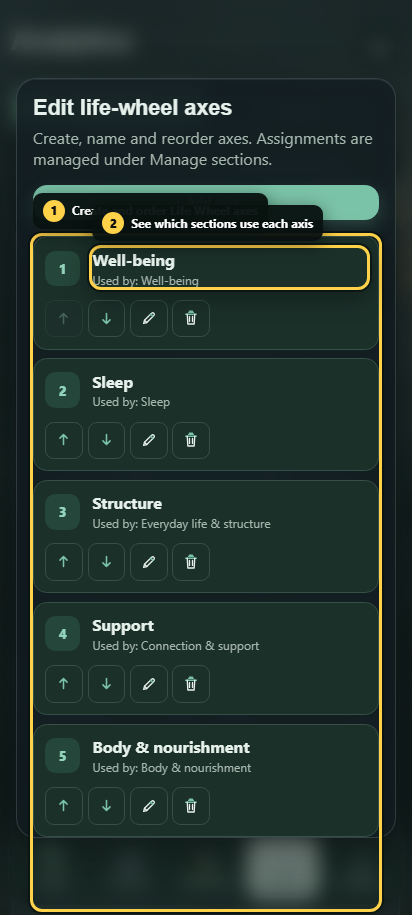
An axis can be deleted only after no section refers to it. Fields are not assigned directly to an axis; they inherit the axis of their section.
Create and configure fields
Basic configuration
A field has at least a name, a section and a type. Numeric types also have a minimum, maximum, step, unit and goal direction.
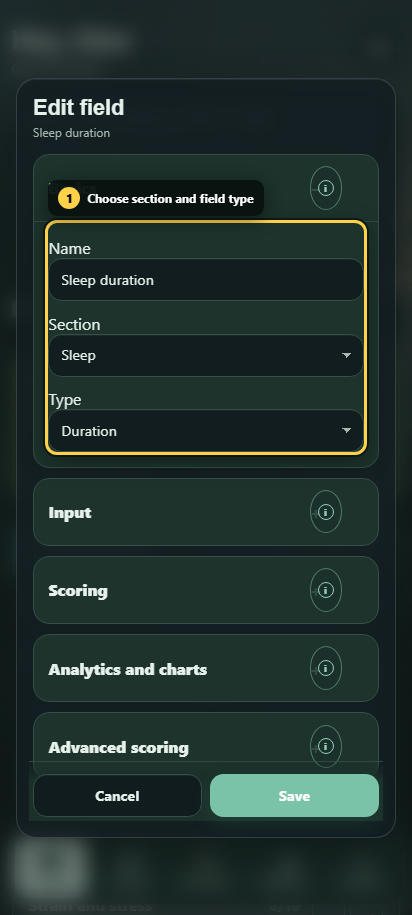
The goal direction defines how a value is evaluated:
| Goal direction | Effect |
|---|---|
| Neutral | The value can be displayed and analyzed but produces no quality signal for the Life Wheel. |
| High | Higher values are interpreted as more favourable. |
| Low | Lower values are interpreted as more favourable. |
| Target range | Values inside the defined range receive the highest quality. Quality outside that range can be configured further. |
Text and choice fields can appear in Explorer, but they do not automatically contribute a quality signal to the Life Wheel.
Analytics access, weighting and Life Wheel role
In the field editor, choose whether a field is enabled for statistics. For Life Wheel fields, you can also choose a weight and whether the field is a state or a supportive action.
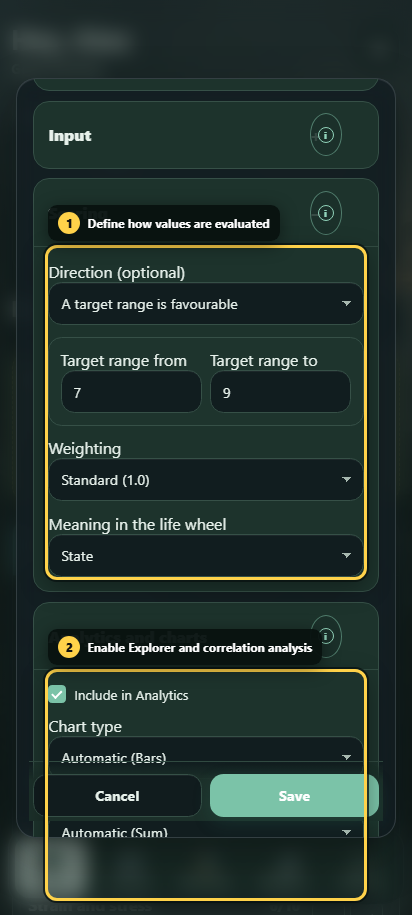
- Analytics enabled: The active field can be selected in Explorer, used for correlations and – with a suitable goal – included in the Life Wheel.
- Analytics disabled: The field remains visible in the check-in and Journal but produces no configurable Analytics or Life Wheel signal.
- State: Describes how you or a life area were doing that day.
- Supportive action: Describes something helpful that you did. It can improve an existing state quality within a limit.
- Automatic: Steady derives the role from field type and goal direction. This is suitable for most fields.
Four fixed weighting levels are available:
| Weighting | Factor |
|---|---|
| Less important | 0.7 |
| Standard | 1.0 |
| More important | 1.5 |
| Very important | 2.0 |
Weighting affects quality inside a section and the time-weighted quality calculation. It does not affect momentum. An important field therefore does not create artificial extra tracked days.
State or supportive action: the concrete difference
Take a section called “Inner stability” with two equally weighted fields:
- Mood: 6 out of 10 → 60% quality
- Meditation: completed → 100% quality
Variant A: Both fields are states
They are averaged as two equivalent statements about your condition:
The section's daily quality is 80%. This is usually too generous: completing meditation does not prove a state quality of 100%.
Variant B: Mood is a state and meditation is a supportive action
Mood forms the 60% baseline. There is a 40-point gap to 100%. At standard weighting, a supportive action may close at most 25% of that gap:
The daily quality is 70%. The meaning is: the condition was mixed, but you did something helpful.
When the action reaches only 50% quality, it adds only 5 points:
| Treatment | Daily quality |
|---|---|
| Meditation as a state | 80% |
| Meditation as a completed supportive action | 70% |
| Meditation as a half-completed supportive action | 65% |
A higher weighting increases the action's influence on quality. With weighting 2.0, the permitted bonus can reach 50% of the remaining gap. Momentum remains unchanged.
When a day contains actions only, those actions directly form the daily quality. This can be appropriate for a section made entirely of routines.
Effect on Life Wheel, Explorer and correlations
| Setting | Life Wheel | Explorer | Correlations |
|---|---|---|---|
| Current field version is active and not superseded | required for new input | selectable | defines the current metric; older versions are included through the field identity |
| Analytics enabled | required for field signals | required | required |
| Numeric, status or yes/no type | can contribute | yes | yes |
| Text field | no | possible as entry count | no |
| Choice field | no | as answer distribution | no |
| Neutral goal | no quality signal | still visible | still usable when numerically convertible |
| Section has no Life Wheel axis | no Life Wheel contribution | unchanged | unchanged |
| State/action role | changes daily quality | unchanged | unchanged |
| Weighting 0.7–2.0 | changes quality calculation, not momentum | unchanged | does not change the raw metric series |
| Chart type/aggregation | unchanged | changes presentation and summary | event aggregation can affect the daily series |
Hidden or superseded historical field versions are not deleted. Stored values can still contribute to historical Life Wheel periods. For Explorer and correlations, the active current version defines the metric while older versions with the same field identity are included in the combined time series.
How the Life Wheel is calculated
For each day, valid signals are first combined per section. State values form the baseline; supportive actions can improve that daily quality within a limit. When several sections point to the same axis, their daily results count equally. The last 28 days are then time-weighted, with recent days counting more than older days.
The visible axis value always combines two components:
- Quality: How favourable were the signals that were actually recorded?
- Momentum: How much recent, time-weighted evidence is available?
The binding formula is:
Quality \(Q\) and momentum \(M\) are internally represented as values between 0 and 1. In percentage form:
Example: One perfect entry from today has 100% quality but initially only about 22.12% momentum:
It therefore produces about 22 points and never immediately 100 points. Repeated recent entries increase momentum. Missing days are not counted as bad days, but they also create no momentum.
How correlations are produced
Correlations use active fields enabled for analytics with yes/no, status, scale, duration or number types, plus selected event metrics. Only days on which both compared values are available are used.
Strict discoveries are shown when at least 14 suitable value pairs exist, there is sufficient variation, and the statistical relationship passes the corrected primary threshold. The additional Emerging patterns category includes stronger possible patterns with at least 20 value pairs that do not yet reach that primary threshold. Correlations do not change the Life Wheel or field scoring. They describe observed joint movement, not causation.
Custom recovery change areas
Under More → General, enable existing change areas or create your own. Several areas can be active at the same time.
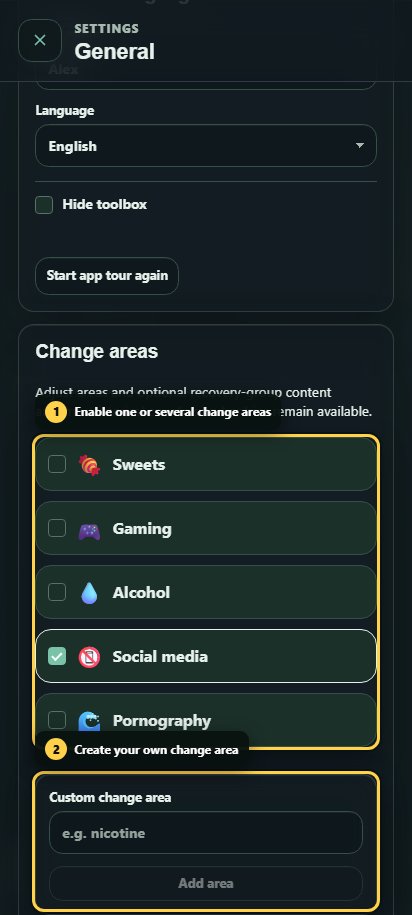
A change area is the domain link for:
- urge and trigger events,
- filtering in Recovery history,
- assigned counters,
- and choosing counters when a relapse is recorded.
Recovery appears in the main navigation as soon as at least one change area is enabled.
Connect counters, urges and resets
Assign a counter to a change area
Every counter belongs permanently to one change area. For an existing counter, that assignment cannot be changed silently because doing so would alter the meaning of its history and resets.
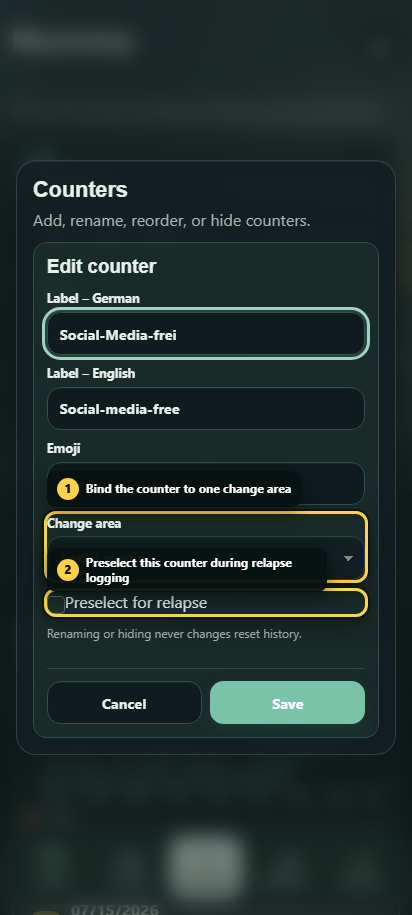
The preselect on relapse option only controls whether the counter starts selected in the relapse dialog. It never performs an automatic reset without confirmation.
Urge, relapse and reset
An urge event can be assigned to one or more change areas. When an urge is stored as a relapse, you explicitly choose which counters are reset:
- no counter,
- exactly one counter,
- or several counters.
The relapse stores the selected reset references together with the urge event. Counter history remains intact and is not overwritten by a new day count.
A manual reset from a counter card also creates an urge/reset relationship with a reason and, from higher intensity, a response. A start date can be adjusted independently. When it is moved before already stored relapses, Steady warns about the effect on the visible run.
No urge is not the same as no entry
- Intensity 1–10: stored urge.
- Intensity 0 / no-urge check-in: explicit information that no urge occurred.
- No entry: unknown; it is treated neither as an urge nor as a successful check-in.
This distinction affects Recovery history, the urge timeline, the Life Wheel signal and the analytics data basis.
Recommended order for a custom configuration
- Create the required Life Wheel axes.
- Create sections and assign them to suitable axes.
- Create fields inside those sections.
- Define type, value range and goal direction.
- Enable analytics only for values you genuinely want to examine in Explorer or correlations.
- Choose weighting and Life Wheel role, or keep automatic detection.
- Create Recovery change areas and their counters.
- Record data regularly for several weeks, then review Life Wheel, Explorer and Patterns together.